


More international visitors came to the US than expected in April 2017, according to the U.S. Travel Association’s latest Travel Trends Index (TTI) – defying expectations of slowed growth or outright decline in reaction to president Trump’s controversial executive orders on travel and immigration, first issued January 27.
In fact, international travel grew by about four per cent year-over-year in April.
Because the average international visitor embarks on a trip to the US 56.9 days after their initial travel search, any fallout from president Trump’s controversial orders in January and February 2017 would only begin to register in April travel data.
“Are we surprised by this data? The honest answer is yes,” said U.S. Travel Association president and CEO Roger Dow. “There have been many claims that the administration’s actions on travel have tarnished America’s brand abroad, but we’re seeing hard economic evidence of the US travel sector’s remarkable resilience.
“Even though we’re encouraged by these strong figures, we’ll continue to urge the administration to more publicly send the message that while the US is closed to terror, it remains open for business. We should not take it for granted that this trend will sustain, and the 15.3 million American jobs that depend on travel are not worth putting at risk. A simple and clear welcome message will go a long way in that regard.”
Dow pointed to remarks by US commerce secretary Wilbur Ross at U.S. Travel’s IPW trade show as evidence that the administration well understands the importance of international travel to the US, and the role that it plays in boosting the American economy, growing exports and supporting jobs.
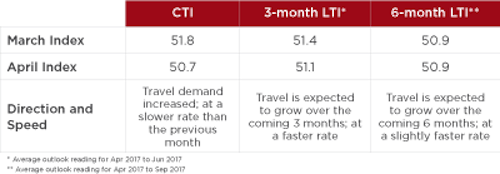
Despite strong international travel growth in April, travel overall grew at a slower year-over-year rate in April 2017 than in March 2017. Domestic leisure travel growth remained strong, while domestic business travel growth tapered, due in part to the timing of holidays like Easter and Passover this year.
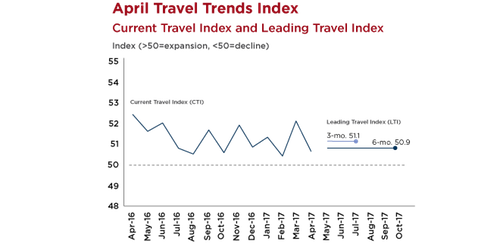
As with many economic indicators, a TTI reading of 50 or more indicates positive growth, while a reading below 50 indicates decline.
The U.S. Travel Association developed the TTI in partnership with Oxford Economics, and draws from multiple data sources to develop these monthly readings. In order to compile both the CTI and LTI readings, the organisation’s research team utilises multiple unique non-personally identifiable data sets, including:
– Advance search and bookings data from ADARA and nSight;
– Passenger enplanement data from Airlines for America (A4A);
– Airline bookings data from the Airlines Reporting Corporation (ARC); and
– Hotel room demand data from STR.
Click here to read the full report.


